Rapport de recherche sur l'état de la recherche sur site dans l'enseignement supérieur avec The Chronicle of Higher Education | Télécharger le rapport
La solution SearchStax Site Search offre aux spécialistes du marketing l'agilité dont ils ont besoin pour optimiser les résultats du site Web.
Présentation du produit
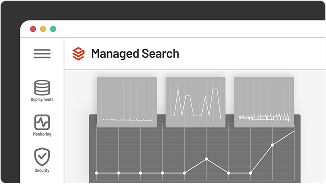
SearchStax Managed Search décharge la gestion de Solr, offrant aux équipes informatiques une agilité opérationnelle accrue.
Présentation du produitAoût. 30, 2017
Sameer Maggon
|
When we originally built SearchStax Analytics, we wanted it to be the best Analytics platform for search insights. Yes, we wanted the typical “vanity” type statistics like total number of searches, click thru rates, and search sessions. But more than just these overview stats, we wanted to create the tools needed for a Search Product Manager, Merchandiser, or Marketer to really understand what their end users where searching for and the search insights they could use to help them make their experience better. Our latest release of SearchStax Analytics continues in this mission. The Search Insights feature within SearchStax Analytics adds a couple of new views: Unique Search Distribution and Search Query Rank. These views show you the queries that are working hardest for you, so you can optimize them for maximum results.
Note de l'éditeur : SearchStudio is now Recherche sur le site SearchStaxIl s'agit du même excellent produit qui permet aux spécialistes du marketing et aux développeurs de rechercher facilement des sites Web.
There are many query-quality metrics available, but they usually summarize the behavior of all user queries over a time period. The Unique Search Distribution view narrows that down so you can focus on the most productive queries. For instance, the view below shows that just three keywords delivered the top decile (or 10% of all searches by volume), while the bottom decile used 12,307 different keywords. This view helps you to answer the question of “Where should you spend your resources on optimization?” We generally recommend focusing on the most popular keywords (moving from left to right) to optimize ROI.
Click on the blue “3” on the graph to see the keywords used in the top 10% of all searches:
Once you have those keywords dialed in, continue to the next decile for optimization. Rinse and repeat until you are satisfied (or you run out of time or budget!)
The Search Query Rank view displays metrics of query quality arrayed against the most-to-least productive queries. For instance, this graph shows that the three most-common queries had a very low no-results rate. At the other end of the graph we see that the overall no-results rate (for all queries in this time period) was almost 15%.
The “Search Query Rank” graphs include:
For more information of the “Insight” feature, see the SearchStax User Documentation. To learn more about SearchStax, the leading Solr-as-a-Service platform, click here.
The Stack est livré tous les deux mois avec des tendances du secteur, des informations, des produits et plus encore